


Contents
Introduction
Survey details
Key metrics
- Unprompted awareness
- Prompted Awareness
- Trial
- Adoption
Conversion effectiveness
- Conversion Effectiveness – Food Segment
- Conversion Effectiveness – Accessories Segment
Overall brand equity
Strategic Example – Entirely Pets
Summary
Introduction
The data for this paper was taken from the myBrandHealth subscription brand health measurement system, a quarterly measure of the health of many markets. For more information about the system or to learn how you can join the community go to “Contact Us” for more information.
Brand health tracking is one of the most important activities of any marketing organisation. Tracking the metrics that matter to brand health allows you as a marketer to:
• Understand the effectiveness of your marketing activities over time
• Develop strategic and tactical directions with confidence
• Identify potential threats quickly and react to them
• Identify new markets and opportunities and act upon them
• Adjust marketing spend and direction depending on market conditions
• Benchmark against your competitors with confidence
The myBrandHealth subscription system makes the exercise simple and affordable.
The data contained in this report are from the retail pet market and this snapshot was taken in the first week of July 2021.
Survey details
Research participants (n=1200) were surveyed online in the first week of July using the online access panel of Pureprofile. Quotas were set to ensure representativeness across gender, age, state, and territory. The results are statistically significant and able to be generalized across the wider population of Australian adults aged 18 years and over.
To qualify for the pet’s section of the survey respondents had to have purchased pet food or pet accessories in the last three months and own a pet. Of the 1200 respondents surveyed 787 qualified for the pet’s section.
The metrics that were collected included:
- Unprompted awareness
- Prompted Awareness
- Ever tried
- Brand Adoption – measured using a four-point scale of the relationship of each brand to the consumer:
- Is my main store, that is the one that I use most of the time
- Is a store that I use
- Is a store that I would consider using
- Is a store that I would not use
As well as these brand health measures two calculated measures are included. These are the conversion effectiveness numbers between the steps in the consumer journey, from awareness to brand adoption.
Key metrics
The key metrics of brand health reported here are awareness, trial, and adoption. These measures and the calculated conversion effectiveness measures form the basis of a complete brand health assessment program.
Unprompted awareness
Consumer awareness is the first step on the pathway to purchase. Making your product known to the target audience and lodging it into the consumer mind space ensures that when the need for your product of service arises you are in the consideration set. If you are not in that space, then being purchased becomes problematic.
Awareness is comprised of two elements, unprompted and prompted. The importance of each type can vary depending on the product category. Unprompted awareness asks the question, “Thinking about the category (in this case pet food and accessories) which retail stores can you think of or come to mind?” This is a recognition measure indicating a high level of cognitive processing and is the first brand touchpoint of a purchase cycle. High unprompted awareness numbers are typically reserved for the market leaders. It is difficult to get to the top and difficult to stay there.
Chart 1: Unprompted awareness
Base: All pet owners (n=787)
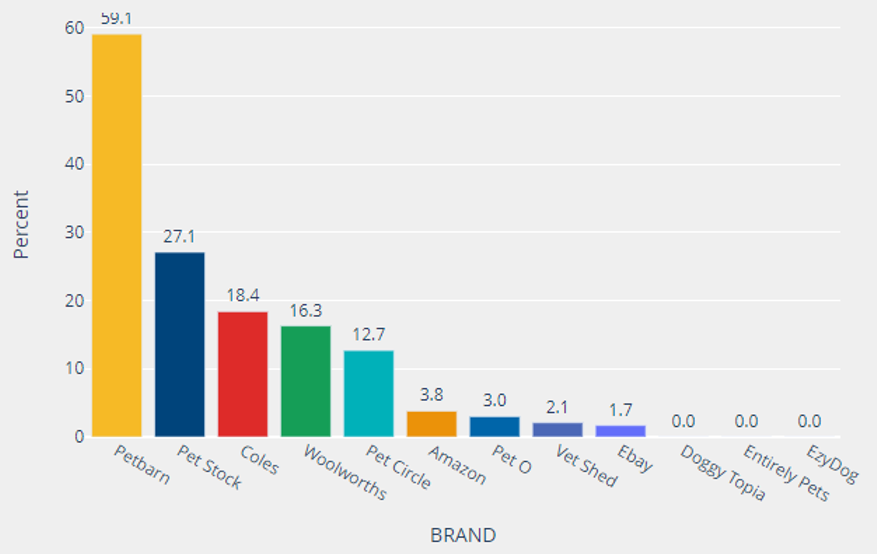
Petbarn (59.1%) is the clear market leader in terms of unprompted awareness. They have a clear advantage over the rest of the market indicating a high level of cognitive processing that has established them as a leading retailer in the consumer headspace.
Pet Stock (27.1%) was next, well behind Petbarn, further emphasising the dominance of the market leader.
The grocery brands are next, Coles (19.4%) and Woolworths (16.3%), which at first glance may appear to be a surprise. However, Woolworths and Coles play in so many markets that it is difficult for them to dominate anyone in the same way that a specialist can. Their prompted awareness number will of course improve.
Pet Circle (12.7%) an online-only store round out the top segment of the market. The rest of the market is all under 5%.
Prompted Awareness
Prompted awareness is determined by displaying a list of brands (stores) to the consumer and asking them; “Looking at these retail stores, which have you seen or heard of before?” It is a recall measure touching a lower level of processing but still a powerful measure, particularly for impulse FMCG products where the purchase environment plays an important role. This survey uses brand logos to maximize the potential of each brand’s recall.
Chart 2: Prompted Awareness
Base: All pet owners
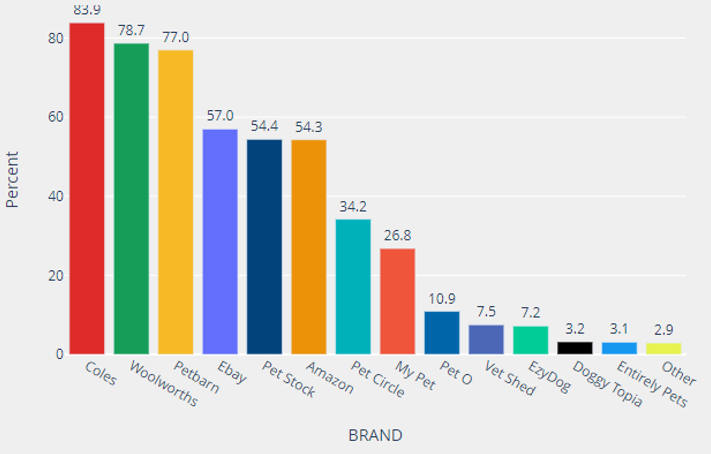
When prompted with the store names the grocery chains top the list. Coles (83.9%) comes in the top over Woolworths (78.7%). The difference with the unprompted awareness scores for the grocery chains indicates that they do not dominate the headspace of consumers in the pet category but there is rather an “aha” moment, as in “Oh of course they stock pet food along with everything else”.
Of the non-grocery brands, Petbarn (77%) is significantly higher than the rest of the market and competes with the grocery brands.
There is a clear second tier of stores that consumers are aware of, eBay (57%), Pet Stock (54.4%), and Amazon (54.3%). These brands are followed by Pet Circle (34.2) and My Pet (26.8%) before we get to the lower segment of the market headed by Pet O (10.9%) and then the rest.
Trial
Product trial is the next step along the pathway to purchase. Trial can be through actual purchase, at a friend’s place, or just walking down the street and stepping into a store. It might occur concurrently with awareness but is still the next step. At this stage the product is on trial. To convert these consumers to adopters the product must perform. Fail and you lose them, succeed and they will come back many times.
For the pet store category, we divided product trial and adoption into two segments, food and accessories. Respondents are asked; “Which of these stores have you ever tried before to purchase food/accessories?”
These charts outline the results for food and accessories
Chart 3: Have tried – Food
Base: All pet owners buying food from the store
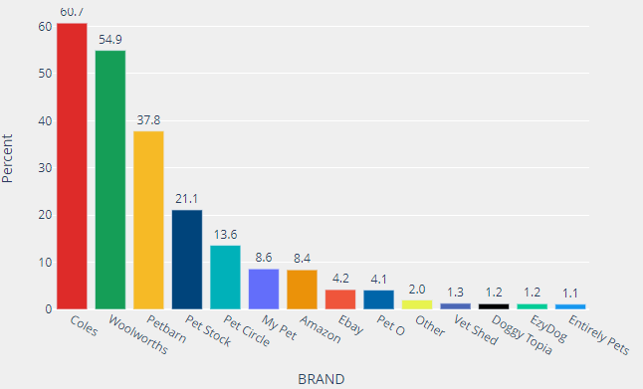
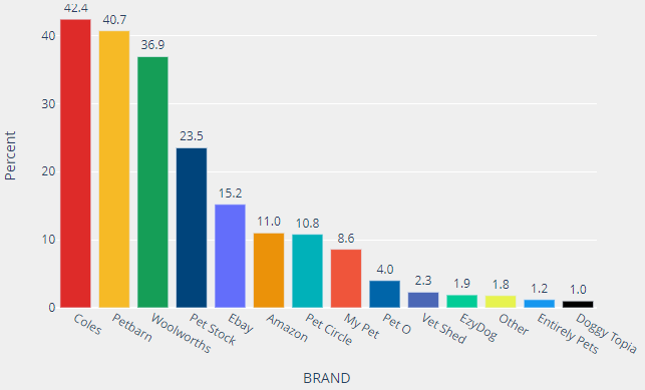
Chart 4: Have tried – Accessories
Base: All pet owners buying accessories from the store
The most tried retail stores for pet food are the grocery lines, Coles (60.7%) and Woolworths (54.9%). They were followed by Petbarn (37.9%), Pet Stock (21.1%) and Pet Circle (13.6%).
None of the other brands in the marketplace have been tried by more than 10% of the market.
The market for accessories is somewhat different. The market leader was still Coles (42.4%) but the next highest store was Petbarn (40.7%). Woolworth’s were further back with 36.9%, then there was a marked drop off to Pet Stock (23.5%), eBay (15.2%), Amazon (11%) and Pet Circle (10.8%).
The rest of the market have all been tried by less than 5% of the market.
Adoption
Measuring adoption is about understanding which customers continue to use your store or product after they have trialed it. It reports the sort of relationship a consumer has formed with your product. myBrandHealth asked respondents to assess their relationship with each of the stores that they have ever tried, using a scale ranging across the different usage possibilities from “Main brand” (the brand I use most of the time) down to a store I would never use (reject).
These are the four possible answers to the adoption scale.
- My main store – that is the one that I use most of the time
- Is a brand that I use
- Is a store that I would consider
- Is a store that I would not use
To make it easier to get an understanding of how you perform in terms of adoption we have created a measure of brand equity from these four answers we call the “Adoption Score”. The adoption score weights the four measures in importance, with “My main store” being weighted the highest down to a negative weighting for, “Is a store that I would not use”.
This provides an easy-to-use measure of brand equity.
For pet stores, the market is divided into two segments when assessing adoption: food and accessories.
Chart 5: Adoption Scores – Food
Base: All pet owners
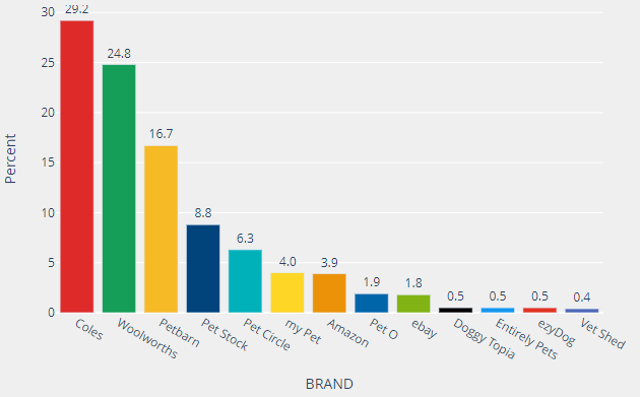
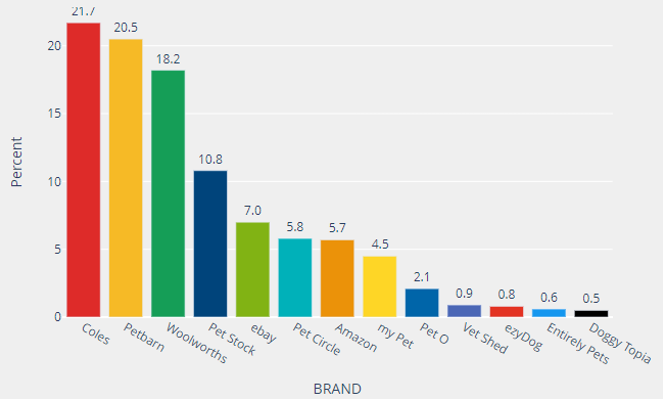
Chart 6: Adoption Scores – Accessories
Base: All pet owners
The retail store with the highest “Adoption Score” for pet food is Coles with a score of 29.2%. They are followed by Woolworths, 24.8% and then Petbarn with 16.7%. The remainder of the market all score less than 10% total share of adoption. No doubt the issues of convenience and price play a strong part in the grocery dominance of the pet food market.
For pet accessories the market is quite different, with the big three being the two grocery chains Coles (21.7%), Woolworths (18.2%) with Petbarn splitting the grocery chain dominance with a score of 20.5%.
Changing your adoption score index involves monitoring the components that it is comprised of. The charts below show the contributions made by each element of the adoption score index; main brand, a store I use, a store I would consider, and a store I would not use (reject). They provide a clearer picture of your consumer’s relationship to your brand and a guide to the types of strategies you need to make in order to grow your overall adoption score.
Chart 7: Adoption Score Contributions – Food
Base: All pet owners buying food
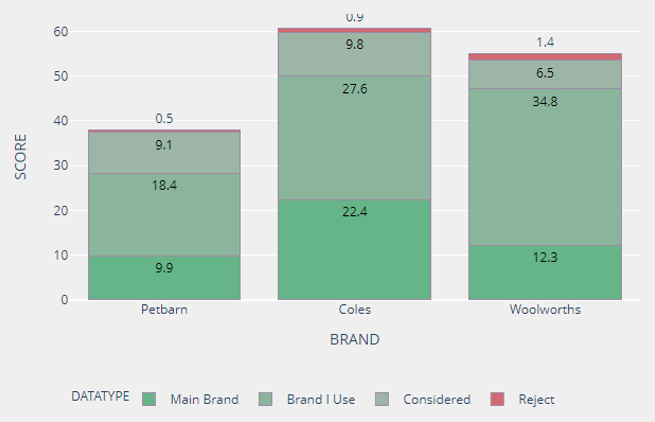
Chart 8: Adoption Scores Contributions – Accessories
Base: All pet owners buying accessories
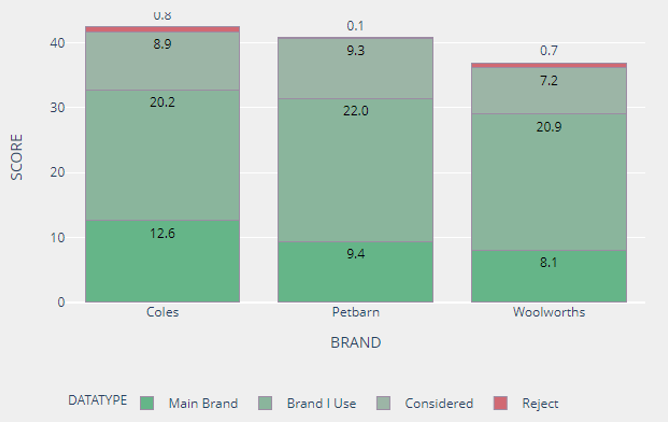
Coles dominate the “Main Brand” scores (the store I use most of the time) for food and accessories and this explains why their brand equity (their adoption scores) are so good.
Petbarn split this dominance of the grocery stores in pet accessories with a score of 9.4% for the main brand and 22% for a brand I use. This explains their strength in the pet accessories segment of the market.
Conversion effectiveness
Conversion effectiveness reports on the ability of brands to move potential customers along the awareness to adoption pathway.
A consumer first becomes aware of a product through one or more of the many marketing avenues deployed by the marketer. Once aware, if the offer is suitably attractive to the consumer, they will try the product. This can involve buying the product or by other means, such as through a friend. This conversion score, from awareness to trial, indicates the effectiveness of your brand offer to create trial.
The metric, awareness to trial conversion, is calculated by dividing the number of respondents who have tried a product by those who are aware of it.
After having tried the consumer may or may not adopt a product. Adopting means they will buy it again and again and it will become a part of their usage set of brands. Adopting a product will depend largely on the performance of the product in meeting the consumer’s needs and expectations.
The metric, trial to adoption conversion is calculated by dividing the number of respondents who have adopted a product by those who have tried.
The conversion numbers measure the ability of the brand to convert consumers to the next stage in the pathway to adoption. A breakdown at any stage in the pathway can hinder product growth. The conversion numbers provide significant feedback and guidance as to any issues in the way of converting potential customers to adopters.
Conversion Effectiveness – Food Segment
The charts below show the conversion numbers from awareness to trial, and from trial to adoption (is my main brand) for all brands in the food segment.
Chart 9: Awareness to trial conversion – Food
Base: All pet owners buying food in the last 3 months
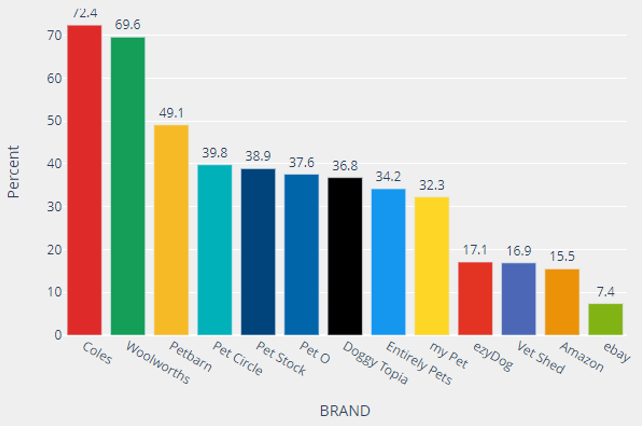
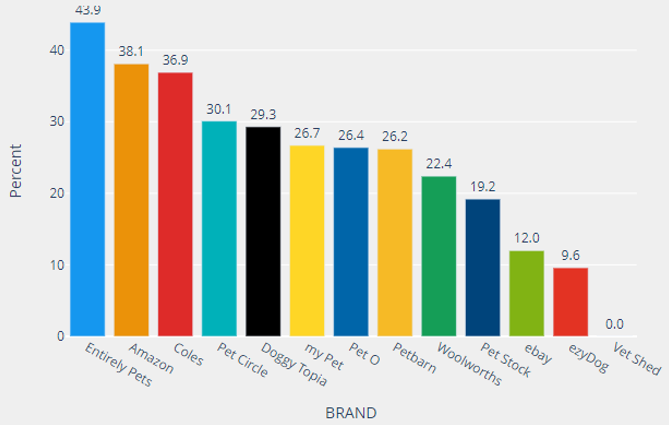
Chart 10: Conversion from Trial to Adoption – Food
Base: All pet owners buying food in the last 3 months
The value of conversion effectiveness metrics is the strategic and tactical directions that they can uncover.
From the charts above grocery chains dominate trial. Most consumers will have used Coles and Woolworths at some time or another to purchase pet food. This is not surprising and demonstrates their ability to convert awareness to trialists.
When we look at the conversion to adoption, the grocery chains drop off significantly. This is because consumers use several stores for their pet food needs and not only the grocery chains. The adoption measure used for this report takes the most extreme measure, that is, those that say that a store such as Coles is their main store, that is the one they shop at most of the time.
This may be too extreme a definition of adoption and it may be more beneficial to combine the top two measures – “Main store” with, ‘One or the stores that I use’, since this indicates regular use and therefore adoption. Whether or not that is a better measure of adoption, this example uses the tougher definition. (Note: members of the myBrandHealth system can choose different definitions if it suits their business model and strategic objectives).
The data shows that 49.1% of consumers who are aware of Petbarn have tried the store. This is a high conversion rate and demonstrates the power of the Petbarn offer. Store locations may be an important factor that drives this number and indicates an opportunity to convert more people into trialists with more stores.
In the adoption chart, we can see that Entirely Pets scored the highest on conversion from trial to adoption. They have a low base of trialists (34.2%) but those that have tried adopt the store at the highest rate in the survey. The strategy for Entirely Pets is clear, get more people to try the product.
Conversion Effectiveness – Accessories Segment
The charts below show the conversion numbers from awareness to trial, and from trial to adoption (is my main brand) for all brands in the accessories segment.
Chart 11: Awareness to trial conversion – Accessories
Base: All pet owners buying accessories in the last 3 months
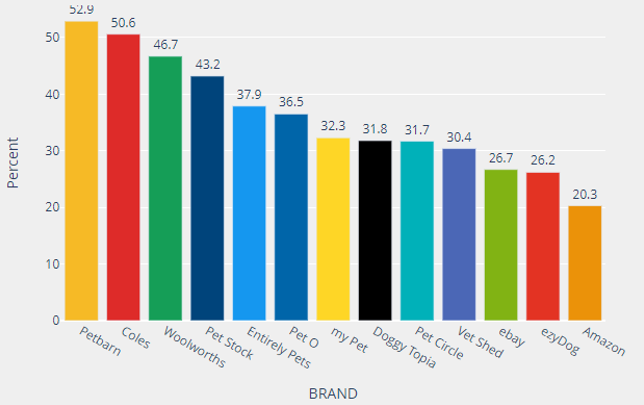
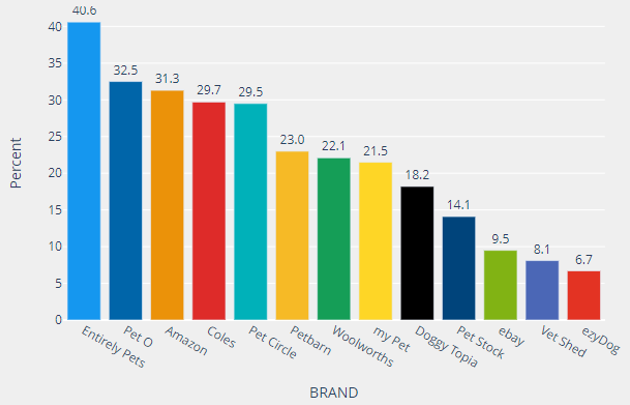
Chart 12: Trial to adoption conversion – Accessories
Base: All pet owners buying accessories in the last 3 months
The accessories market is a markedly different story when compared to food and is far more competitive. The grocery chains provide a service in this area but do not provide the depth that the focused players in the market can.
Petbarn (52.9%) converts awareness to trial at the highest rate in the accessories segment. They were followed by Coles (50.6%) and Woolworths (46.7%), then Pet Stock (43.2%).
Entirely Pets convert their trialists to adopters at the highest rate (40.6%) which has been consistent over the last two waves. Petbarn convert trial to main brand adoption at a rate of 23.0%.
What does this mean for Entirely Pets? Their trial to adoption conversion score is high partly because they have a very low base of aware respondents, but it may also indicate that they provide a very effective level of service. We will explore this further in the strategic example below.
Overall brand equity
The overall brand equity chart displays the Adoption Score, a score calculated from the respondent’s combined relationship to each brand, from main brand to a reject brand, and indexes these scores to 100%. It shows the relative consumer brand power of all the brands in the marketplace and provides a reliable and stable measure of overall brand health.
The chart below maps the adoption score (the size of the dot) on the axes of “Ever
Tried” and “Prompted awareness”.
Entirely Pets has been highlighted for example purposes.
Chart 13: Adoption Score by Trial and Prompted Awareness
Base: All pet owners buying food in the last 3 months
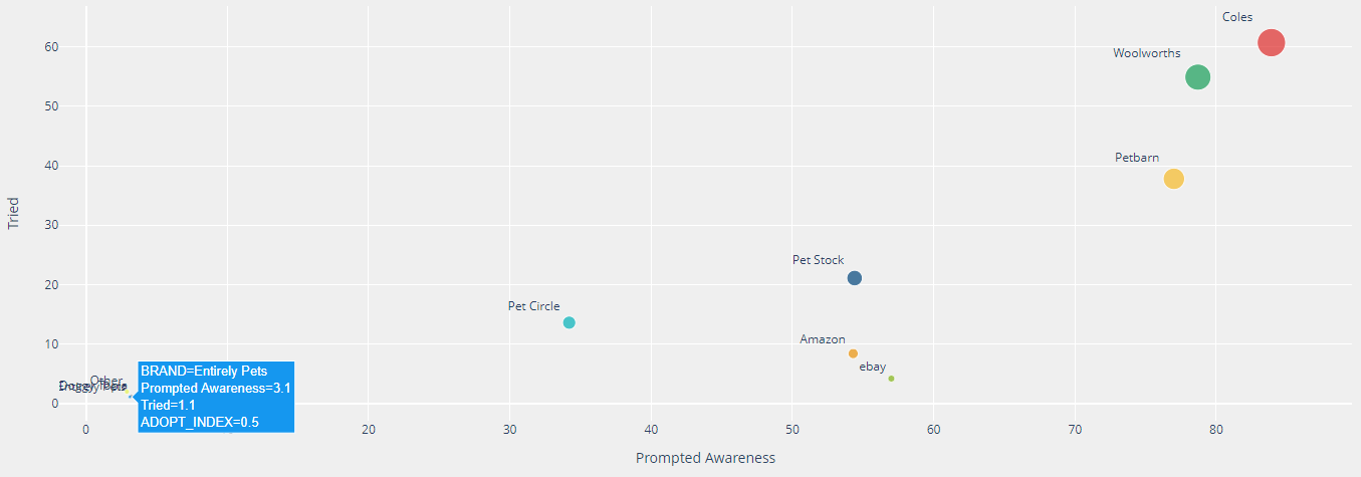
Chart 14: Adoption Score by Trial and Prompted Awareness
Base: All pet owners buying accessories in the last 3 months

Using these charts provides a clear picture of the market position according to brand health measures in the overall pet market space.
In pet food the grocery chains dominate the market followed closely by Petbarn.
The same is the case in pet accessories except that Petbarn is more competitive with the chains.
Strategic Example – Entirely Pets
As an example of the strategic implications of brand health data let’s look at Entirely Pets. They are the most successful at converting trial to main brand adoption in accessories, 40.6%, and in awareness to trial they rank fifth on 37.9%. In the food segment they convert trial to main brand adoption the highest at 43.9% and they convert awareness to trial at 34.2%. Compared to the rest of the market these are very respectable scores.
These types of conversion scores indicate to a marketer that their product performs. They are delivering a high degree of satisfaction which results in converting trialists to adopters. Their overall brand equity score is very low, with an Adoption Score of just 0.6% and a trial rate of just 1.2%.
These figures strongly suggest a broad strategic goal of building brand awareness would reap significant rewards. We know they can convert their awareness to trial and trial to adoption. Focusing on awareness and adopting aggressive tactical measures with this aim would result in significant gain.
If I was an opposition marketing manager, I would be asking myself, “What is it that is driving these conversion figures?” Is it simply a highly dedicated small following or is there something systematic about their offer that I need to investigate and learn from, even emulate? Despite their current overall size, they are a potential threat.
Summary
Brand health tracking with our easy-to-use myBrandHealth tracking dashboard from SMP Surveys makes strategic planning and tactical assessment simple and easy.
All charts on this report were cut from the online portal dashboard.
The portal also allows you to dive deeply into the data with segmentation across a large section of demographics including, gender, age, income, family structure, education levels, state, and MGB status. This is where the real power lies.
To learn more about myBrandHealth and how you can join the service visit our contacts page.